The style of a line
The style of a line in a plot has three characteristics; the marker, the color and the line. They can be specified using the keywords map or the formatting string.
They keywords map is a possibility to specify additional parameters for the plot commands. To set the line style it can be used as follows.
// for a red dashed line with circle markers
plt::plot(x, y, {{"color", "red"}, {"marker": "o"}, {"linestyle": "--"}})

// shorthand notation for color and linestyle is usually supported
plt::plot(x, y, {{"c", "red"}, {"marker": "o"}, {"ls": "--"}})
See sections Marker, Color and Line for supported values.
The formatting string is a convenient notation to set the style of a line. Almost all plot commands support the formatting string as first argument after the x and y data.
A formatting string’s structure is
s = "<marker><color><line>"
The rules are
- The valid parameters (
<>) are listed in the following sections.- Different ordering of the parameters is supported. However, to avoid ambiguity this order should be used throughout.
- Parameters might be dropped.
- If only the colour parameters is specified, more color parameters are supported, see section Color.
Examples
"b"    // blue line
"og"   // green circles, no connecting line
"og-"  // green circles with connecting line
"r--"  // dashed red line
"seagreen"  // a solid line in the colour seagreen
"#008000"   // a solid line coloured in the HEX code
The following sections list the supported markers, colours and linestyles.
Marker
| character | marker |
|---|---|
o |
circle |
s |
square |
D |
diamond |
d |
thin diamond |
p |
pentagon |
H |
hexagon type 1 |
h |
hexagon type 2 |
v |
triangle down |
^ |
triangle up |
< |
triangle left |
> |
triangle right |
* |
star |
+ |
plus |
x |
x |
. |
point |
, |
pixel |
| |
vertical lines |
_ |
horizontal lines |
1 |
tri_down marker |
2 |
tri_up marker |
3 |
tri_left marker |
4 |
tri_right marker |
Line
| character | line |
|---|---|
- |
solid |
-- |
dashed |
: |
dotted |
-. |
dash-dotted |
Color
The color can be specified via a character code, a tableau color, a full name or a HEX code.
Note
If a formatting string contains more parameters than just the color, only the character code is supported.
Character code
| character | color |
|---|---|
b |
blue |
r |
red |
g |
green |
c |
cyan |
m |
magenta |
y |
yellow |
k |
black |
w |
white |
The resulting colors are
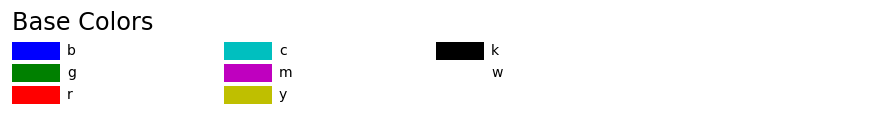
Tableau color
The tableau colors are the default colors of the MPL color cycle. If no color is specified, the color of the lines will iterate over these colors.
The tableau colors are
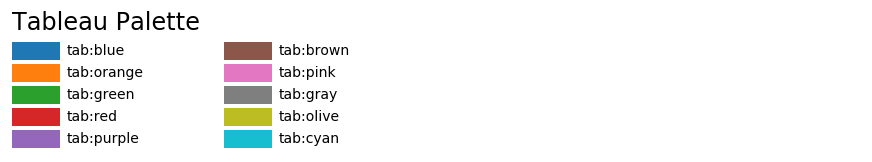
Instead of tab:<colorname> it is equivalent to use C<color number>.
The colors are numbered according to above image and C0 is tab:blue and
C9 is tab:cyan.
Examples
plt::plot(x, y, "tab:green");  // equivalent to "C2"
plt::plot(x, y, "C3");         // equivalent to "tab:red"
plt::plot(x, y);               // automatic coloring: "tab:blue"
plt::plot(x, y);               // automatic coloring: "tab:orange"
plt::plot(x, y);               // automatic coloring: "tab:green"
Full name
To make way for your creativity all colors in the following table are supported. It’s a perfect way to waste a lot of time.
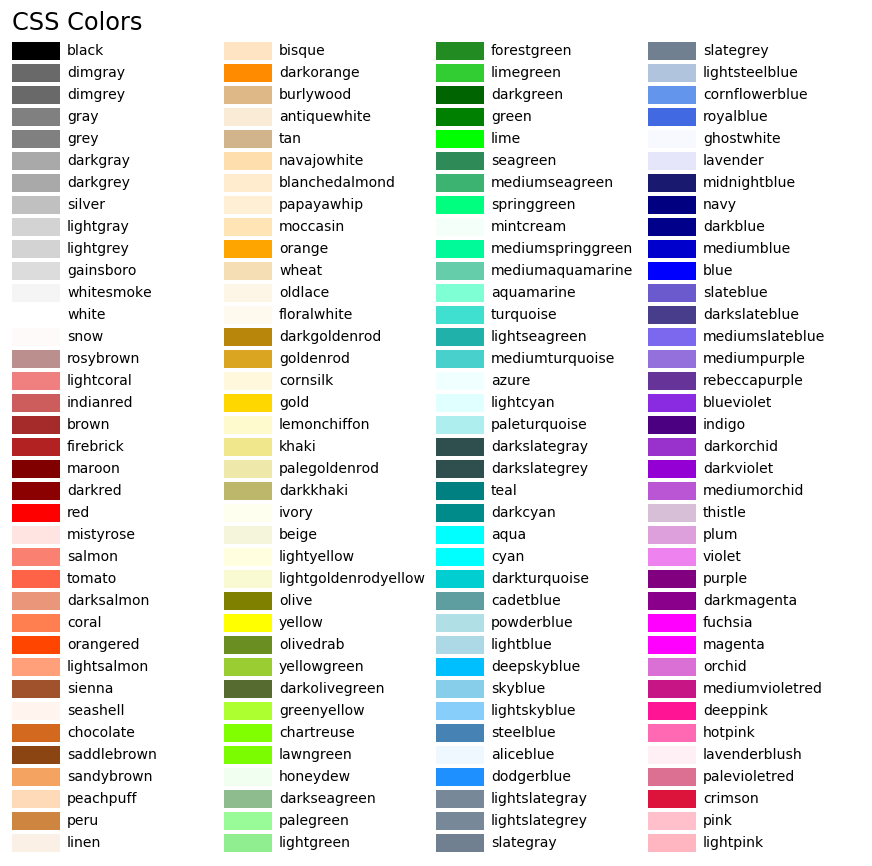
Examples
plt::plot(x, y, "seagreen");
plt::plot(x, y, "firebrick");